2018 Third Report
Atmosphere and Ocean Research Institute, The University of Tokyo
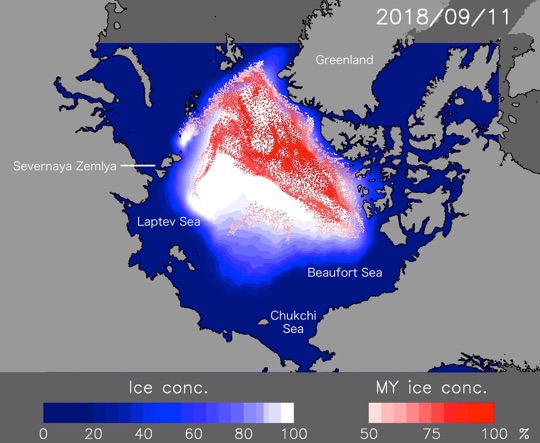
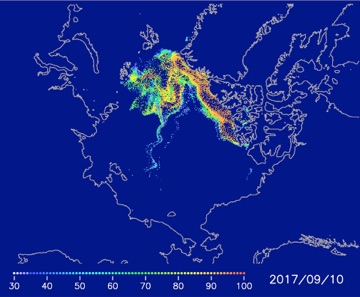
- Most of the multi-year ice in the Arctic is distributed in Greenland-Canadian Archipelago side. It also spread toward Beaufort and Chukchi Seas and extends to the Laptev Sea and Severnaya Zemlya. This pattern will be maintained during this summer.
Prediction map is also available in Arctic Data Archive System of National Institute of Polar Research.
Analysis of multi-year ice distribution
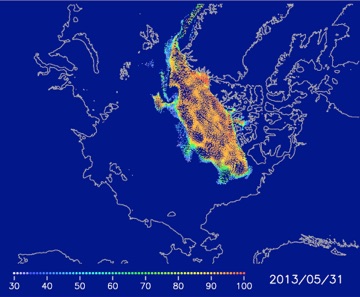
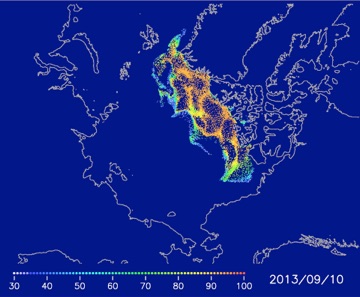
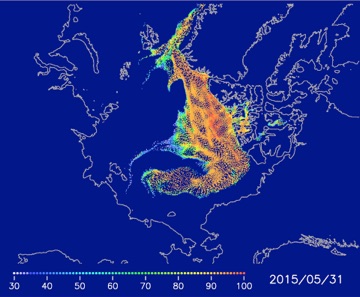
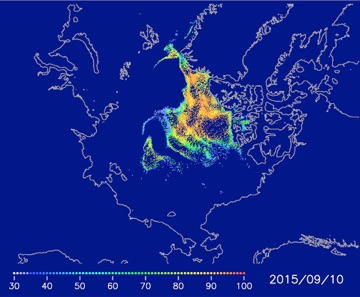
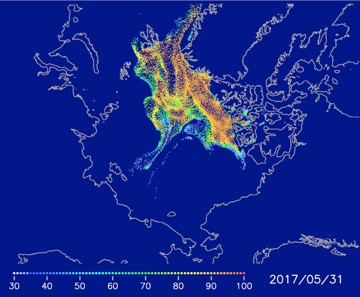
To detect the distribution of multi-year ice (MYI) in the Arctic, we tracked the sea ice from the September minimum to the next year using the daily sea ice motion derived from AMSR-E and AMSR2 data.
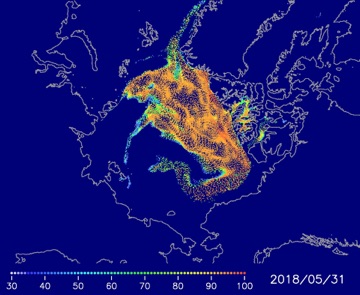
We found that the MYI distribution in summer is similar to that in the late spring (Figure 5, 6 and 7).
In this prediction, we first derived the MYI distribution on May 31 of this year by the tracking. Then, daily change of the MYI from June to September is estimated using mean ice motion for each day averaged over 2004-2017.

If you have any questions about satellite monitoring of the Arctic Ocean, sea ice forecasting, or the forecasting methods used here, please contact the Sea Ice Information Center(sea_ice@nipr.ac.jp)

The research for this forecast method was started in GRENE Project. The sea ice forecast was conducted in ArCS Project (FY2015-2019).