Field Research Around Qaanaaq Coast, Northwestern Greenland 2023
Research teams of the Research Program on Coastal Environments in the fields of marine, glaciers/ice sheet, land/atmosphere, humanities, or others conduct a variety of research observations around Qaanaaq in northwest Greenland from July to September 2023. Please enjoy reports from the research teams along with photos.
Table of Contents
Narwhal hunting off Qeqertat in northwest Greenland(2023/10/31)New!
Waste dumping site and living environment survey, in Qaanaaq, northwest Greenland
Landslide survey in Siorapaluk, Northwestern Greenland(2023/9/26)
Workshop in Qaanaaq, Northwest Greenland (August 3, 2023)(2023/9/14)
Field observations at Qaanaaq Glacier and its outlet stream in northwestern Greenland(2023/9/6)
Narwhal hunting off Qeqertat in northwest Greenland
Writer:Mayuko Otsuki (Hokkaido University)
Monica Ogawa (Hokkaido University)
We accompanied an experienced hunter and his two assistants for narwhal (Monodon monoceros) hunting from August 17 to 21, 2023. Narwhals migrate off Qeqertat (Inglefield Bredning), northwest Greenland during summer months. This area is one of the few areas in Greenland where traditional hunting methods using kayaks are still practiced for narwhal hunting. The tusks and mattak (sliced blubber and skin) of narwhals are an important source of income for the Inuit and villagers. Because the narwhal is the marine top predator of the region, studying diet and contaminants of narwhal helps understand the impacts on the ecosystem in the region, on narwhals and even on human.
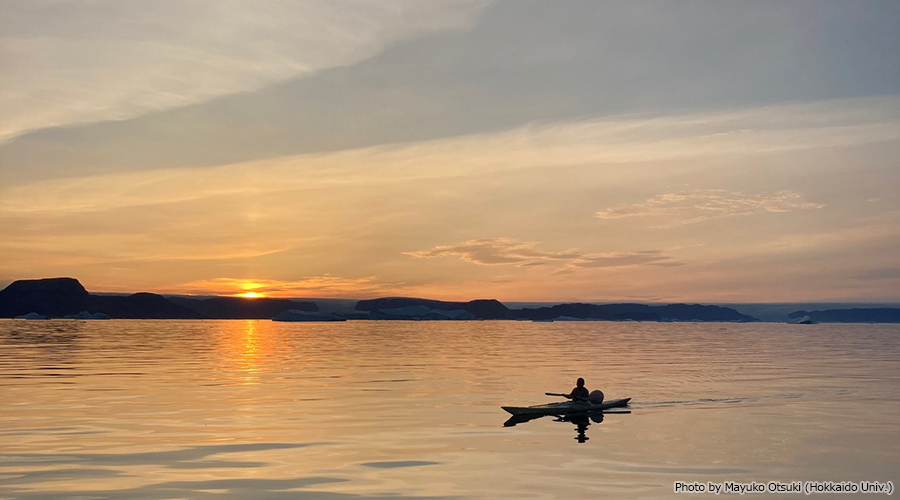
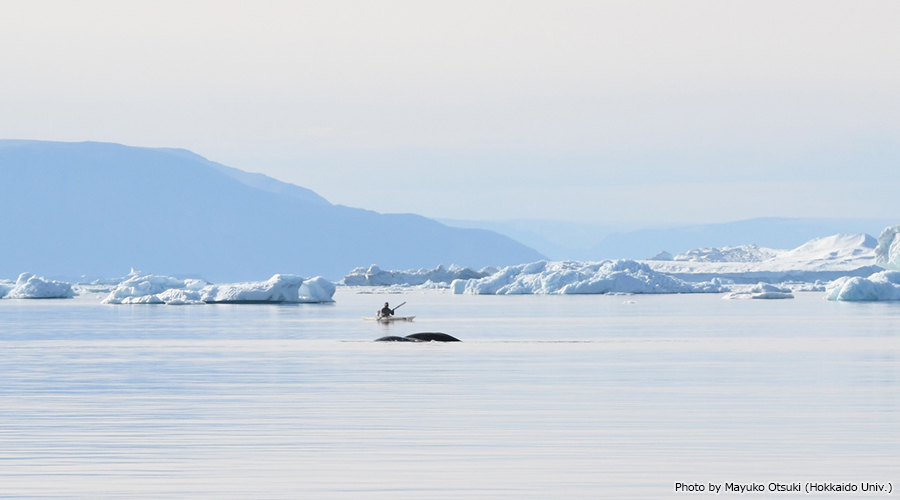
We have joined the hunting to collect materials to study diet and contaminants. We left Qaanaaq for Qeqertat at 11 pm on August 17. We wait for narwhals to come off Qeqertat. We found a pod of narwhals at 2 am. One hunter jumped on his kayak to approach to the pod, but it was unsuccessful (Fig. 1). Later, two hunters captured for a total of three narwhals for over the four days (Fig. 2).
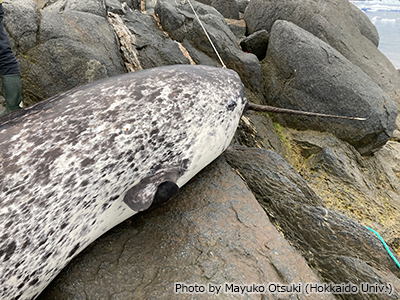
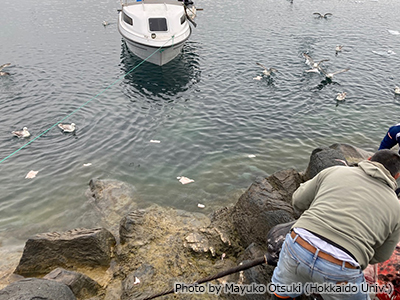
We dissect these narwhals during low tides (Fig. 3). Before dissections, we measured the length of a narwhal. Norther fulmars (Fulmarus glacialis) started gathering near the narwhal before dissection, and fed on pieces of narwhal blubbers that were thrown into the water (Fig. 4). We collected stomach, muscles, livers, and eye balls. We use stomachs to identify diet of narwhals, muscles for stable isotope analysis and contaminants, livers for contaminants and eye balls for age estimation. We hope that we can report our results in other opportunities that we may have.
(2023/10/31)
Waste dumping site and living environment survey, in Qaanaaq, northwest Greenland
Writer:Yasumasa Tojo (Hokkaido University)
Taro Mori (Hokkaido University)
Tatsuya Fukazawa (Hokkaido University)
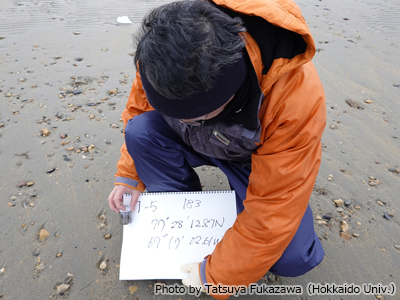
We arrived in Qaanaaq on September 9th, and from the next day onwards, we conducted a field survey and collected soil samples.
We conducted a survey on waste in the same area last year, and based on the results of that survey, we planned a more detailed sampling this time. According to interviews in Qaanaaq village, open burning of waste was discontinued from December 2022, and combustible waste has been incinerated once a week in small hut near the site. Therefore, we had the impression that the amount of waste is increasing.
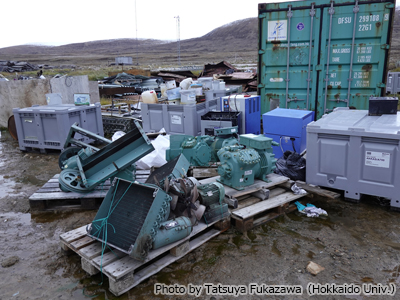
In addition, it was confirmed that as a new attempt, hazardous materials (batteries, waste oil, etc.) are accumulated around the hut and backhauling is trying to carry out. It seems that improvements are being made little by little.
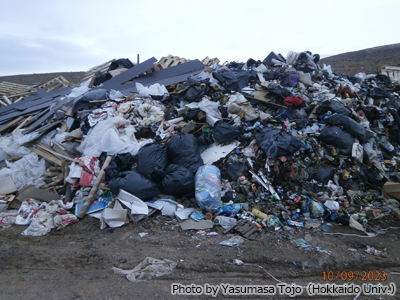
This year, sampling was mainly focused on soil and sediment from the tidal flats in the direction of the sea from the dump site. Seven sampling lines were set up downstream of the residue after open burning site, human excreta dumping site, direct landfilling site, and hazardous/recyclables storage site. And samples were collected from a total of 35 locations. In some places, black mud appeared directly below the topsoil, and there was a hydrogen sulfide odor, suggesting that the impact of the dump site seemed to extend to the sea side.
Air quality was measured at the dump site using the VOC Index. The VOC concentration increased after midnight. The wind velocity was probably high during the daytime, but after midnight, the gases generated from the waste stayed around the dump site because of low wind velocity, and high values were measured.
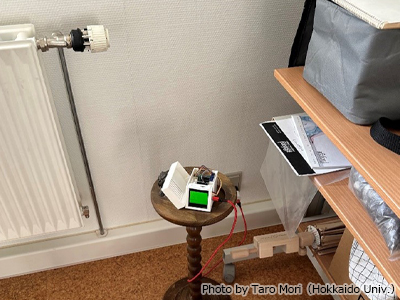
We also surveyed indoor environment, etc. We collected the sensors installed during the last year’s visit and found that the indoor environment of the guest house for short-term stays and a general residence had been stable throughout the year. Since the outdoor temperature was not very high, the rooms were always heated, and the humidity level was very low due to the introduction of outside air into the rooms through ventilation. The indoor environment of the boiler room, where outside air is introduced into the guest house, was also measured, and both PM and VOC values tended to be higher in the summer season. The same tendency was observed in the general resident house.
We interviewed a resident about energy costs. Although the energy cost is currently rising all over the world, the cost in Greenland is stable due to the long-term contract. However, the contract will expire at the end of 2023 and a new contract will begin, at which time energy costs are expected to rise significantly.
(2023/9/27)
Landslide survey in Siorapaluk, Northwestern Greenland
Writer:Tatsuya Watanabe (Kitami Institute of Technology)
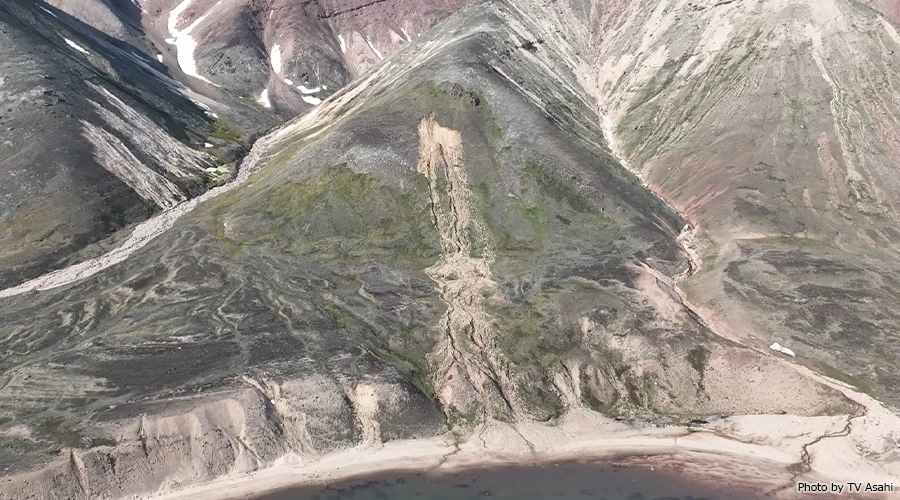
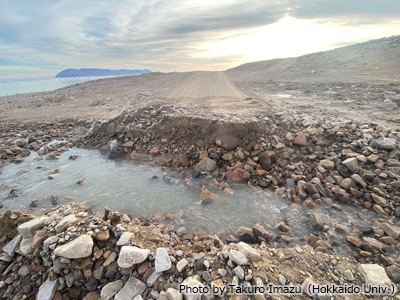
We surveyed the landslide mechanism around Siorapaluk settlement from July 27 to August 3, 2023. The landslides are generally characterized by shallow collapse depth of about 2 to 3 meters, but they flowed down to the coastline several hundred meters away as debris flow(Fig. 1). These landslides were triggered by heavy rains in the summers of 2016 and 2017. However, the heavy rain events are not the only reason why a number of huge landslides occurred. We think that geological structures and permafrost also play an important role in the occurrence of the long-distance landslides.
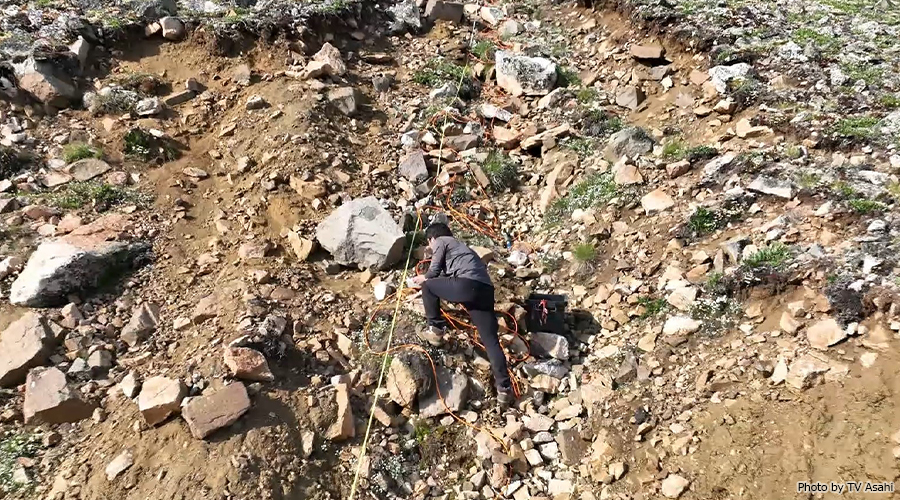
In this year’s survey, we applied electrical exploration to understand the internal structure of the landslide (Fig. 2). The electrical exploration measures the distribution of underground resistivity by sending current from a number of electrodes installed on the ground. The cross-sectional diagram of the electrical exploration showed a low resistivity (moist) zone near the collapse source.
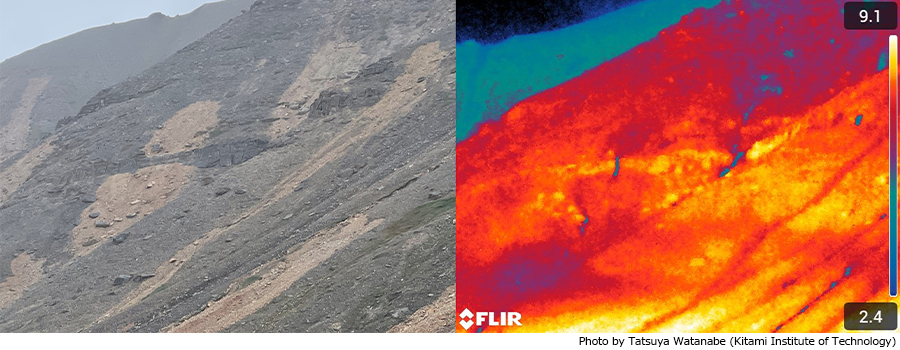
We also attempted to detect springs on the landslide slopes using thermography. The slopes had been dry because of little rain, resulting in no springs detected at first. However, at the end of the survey period, when it rained for the first time in a while, thermography detected spring water coming from the landslide sources (Fig. 3).
The results of electrical exploration and thermography indicated that subsurface structures tend to collect water near the landslide sources. Such structures are often hidden by unstable debris covers in cold regions with low landslide frequency. If the amount of rainfall increases in the future due to climate change, the risk of debris-flow occurrence will increase. It is important to tell residents the risks of slope disasters.
(2023/9/26)
Workshop in Qaanaaq, Northwest Greenland (August 3, 2023)
Writer:Evgeniy Podolskiy (Hokkaido University)
Takuro Imazu (Hokkaido University)
Shin Sugiyama (Hokkaido University)
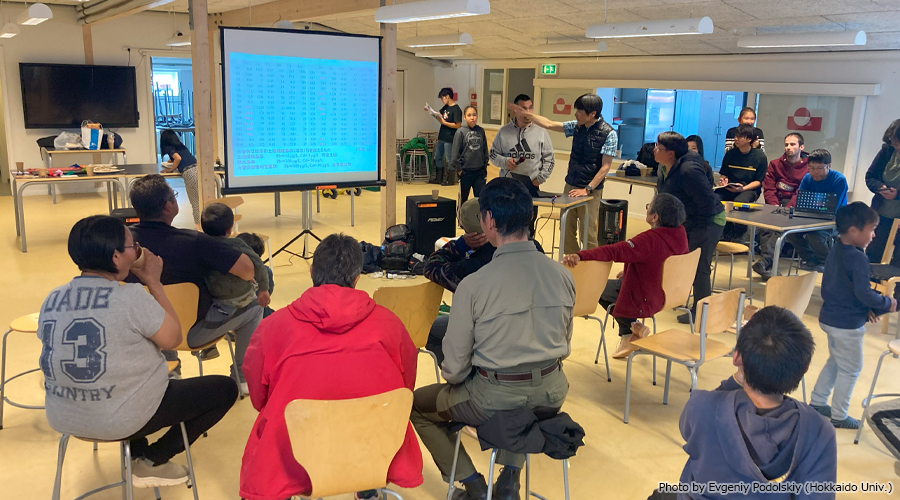
What happens if you travel to one of the most northern settlements in the world and mix the following ingredients? Innuits, kids, Japanese sushi, cookies, powerful loudspeakers, slides, and lots of coffee (Fig. 1)? Of course, a workshop! Such kind of public events have been held by the members of our expedition almost annually in a small village of Qaanaaq, Northwest Greenland, and this year was not an exception.
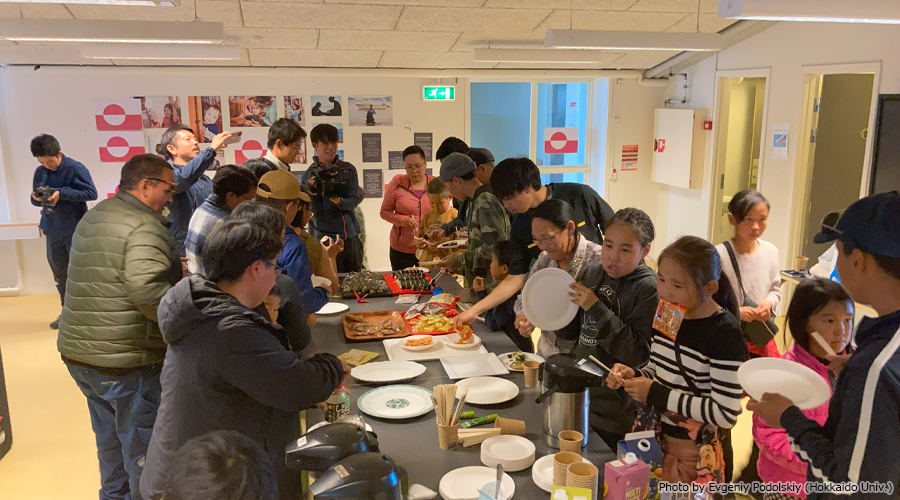
This summer, on August 3, we organized a workshop in collaboration with locals and it was a blast (at least in our opinion). Moreover, this time we had the youngest audience ever, because many families came all together. In total, around 40 people and a film crew from Japan gathered in the local school building to listen to presentations by 5 members of our expedition (Fig. 2). This was not only an opportunity to explain what kind of research the expedition had been conducting, but also allowed us to exchange information with the locals. In addition, during coffee breaks, some valuable interviews could be conducted with locals.
In the beginning, our key local supporter, Ms. Toku Oshima, introduced us to everyone. Then, the leader of our expedition, Prof. S. Sugiyama (ILTS, HU) briefly outlined the key objectives of field observations and expressed concerns about the potential threat from waste-management practices in the village. Afterwards, Assoc. Prof. E. Podolskiy (ARC, HU) played sounds of ice and animals recorded around Qaanaaq and used to understand otherwise unseen environmental dynamics. Later, M.Sc. candidate T. Imazu (GSES, HU) told about the Qaanaaq ice-cap melting and runoff monitoring, which strongly affect the strategically important road between the airport and the village. Next, Ph.D. candidate M. Ogawa (GSES, HU) presented her work on seals’ diet and the ongoing bio sampling effort, aiming to understand migration of pollutants through the tropical chains. Finally, historical photographs taken in the region (from the 1970s) and shown by Dr. R. Kusaka (ILTS, HU) were welcomed with a greatest interest and some participants could recognize their relatives or even themselves.
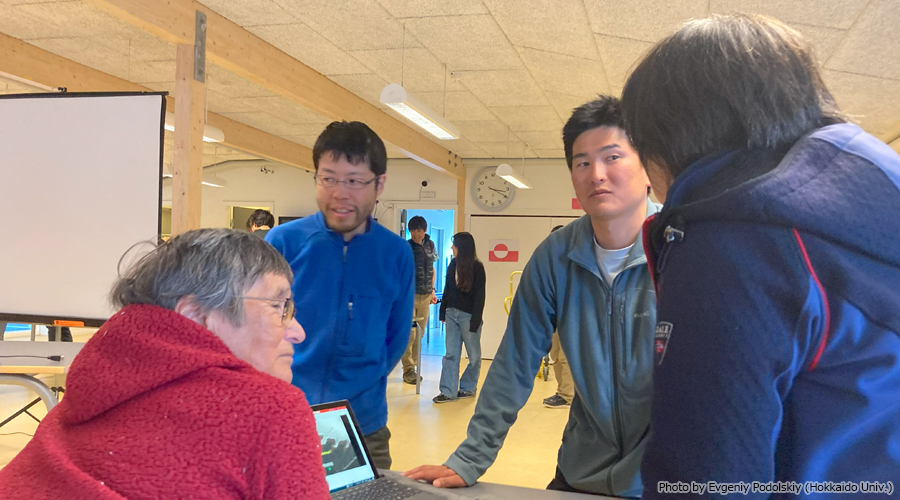
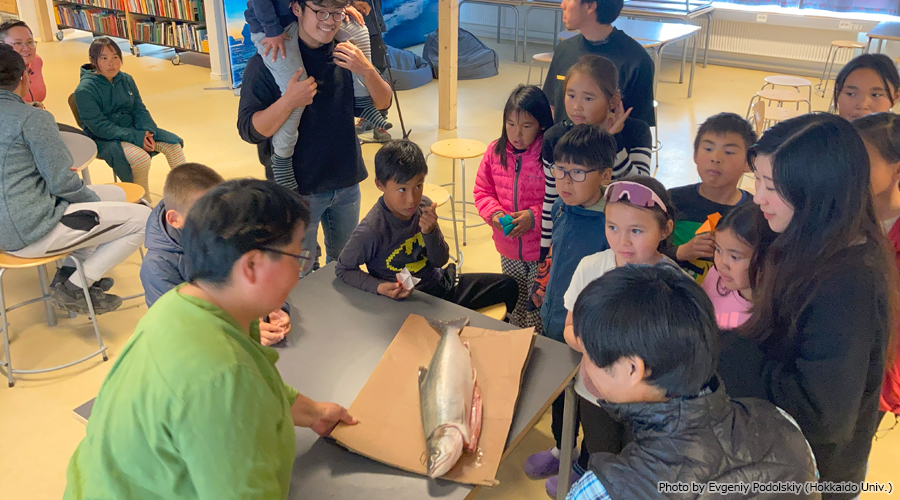
Thanks to a simultaneous translation to Greenlandic and earlier rehearsals aiming to find the right words, our communication with locals was smooth and easy (Fig. 3). With kids playing in the room, the atmosphere was relaxed and joyful. On top of everything, we even got a giant Arctic Char as a present, which we grilled for dinner (Fig. 4). We are certainly looking forward to this kind of event next year again! Let’s see if the fish will be even larger!
(2023/9/14)
Field observations at Qaanaaq Glacier and its outlet stream in northwestern Greenland
Writer:Nonoka Mineshige (Hokkaido University)
Soratakato Yamada (Hokkaido University)
Takuro Imazu (Hokkaido University)
Shin Sugiyama (Hokkaido University)
Some members of the ArCS II Coastal Environment Program carried out observations at Qaanaaq Glacier and its outlet rivers from July 8 to August 12, 2023.
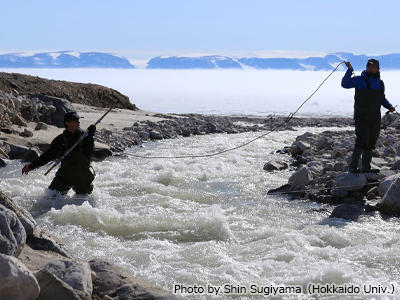
In 2015 and 2016, the glacier outlet rivers flooded and destroyed an important road connecting the village and airport. The disasters were caused by intensive glacier melting as well as heavy rain events. To better understand the impact of climate change on the society of Qaanaaq as well as the glacier, we have measured river discharge since 2017. This summer, we measured discharge 54 times (Fig. 1), while the water level was continuously monitored with pressure sensors. We also installed acoustic and infrasound recorders to find relationships between the measurements and discharge. During the campaign this summer, flooding and destruction of the road occurred twice in July and August (Fig. 2). We work on the collected data to contribute to the prediction and mitigation of such disasters.
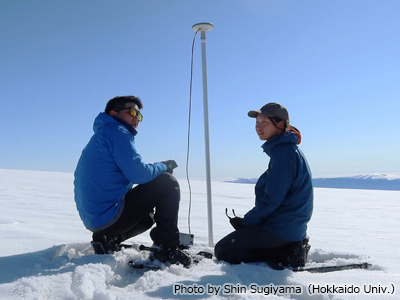
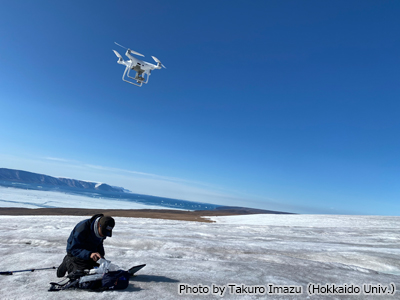
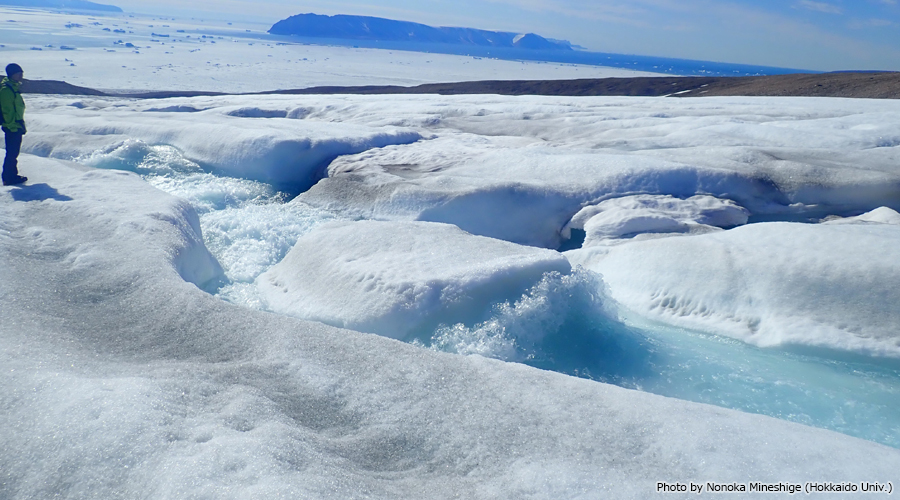
On the glacier, we have been monitoring the mass balance and flow velocity for more than 10 years since 2012 (Fig. 3). In 2022, we started drone survey to analyze glacier changes from high-resolution images and digital elevation models (Fig. 4). Since the ice temperature of Qaanaaq Glacier is below 0°C, meltwater does not penetrate into the glacier and forms channels on the glacier surface. One of the objectives of the drone survey is to analyze the formation and development of these channels (Fig. 5). We have succeeded six drone flights, covering the area from the terminus to the upper reaches of the glacier. Under the influence of relatively fine weather conditions, intensive melt, channel formation and ice darkening due to glacial microbes were observed in July. High resolution images should help us to understand the mechanism of rapid glacier changes.
(2023/9/6)