2017 Third report
Atmosphere and Ocean Research Institute, The University of Tokyo
- Minimum ice extent in September will be about 4.81 million square kilometer.
- Ice retreat in the Chukchi Sea will be faster than normal years.
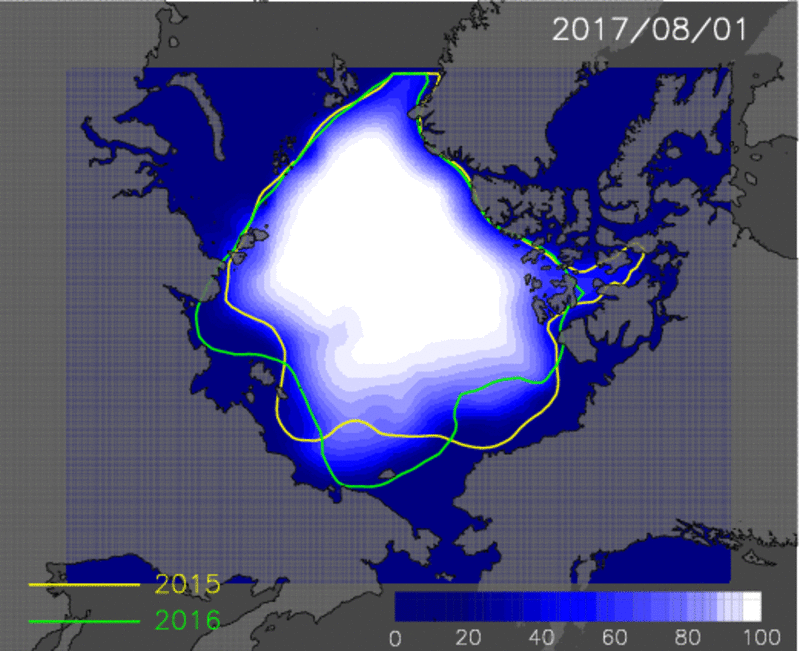
- Sea routes of Russian side and Canadian side will both open.
Russian side will open around August 16. Canadian side except for Canadian archipelago has opened around July 18.
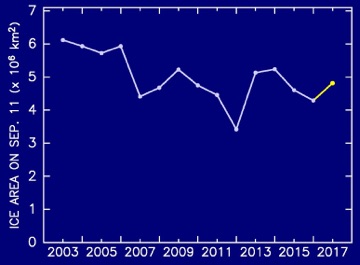
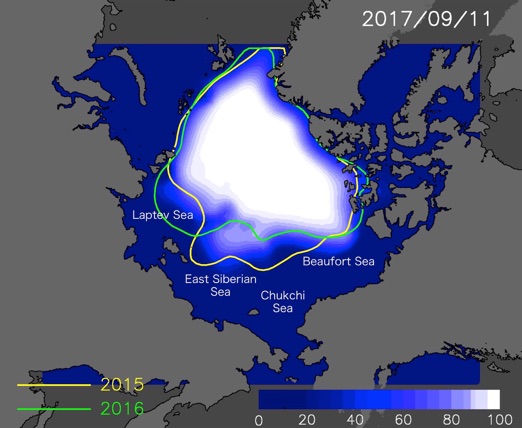
Sea ice extent on September 11, which is the minimal area phase of Arctic sea ice, is expected to be 4.81 million square kilometer, which is 12% larger than the last year and 5% larger than the first report.
Sea ice in the Laptev Sea and Chukchi Sea is expected to be thin and retreat quickly compared with the last year. On the other hand, sea ice in the East Siberian Sea will retreat slowly with nearly same speed as normal years. Sea routes of the Russian side will open around August 16, which is almost equal to the last year.
On the Canadian side, sea ice in the Beaufort Sea is expected to be thick and retreat slowly compared with the last year. The sea routes of the Canadian side except for Canadian archipelago has opened around the July 18.
Prediction map is also available in Arctic Data Archive System of National Institute of Polar Research.
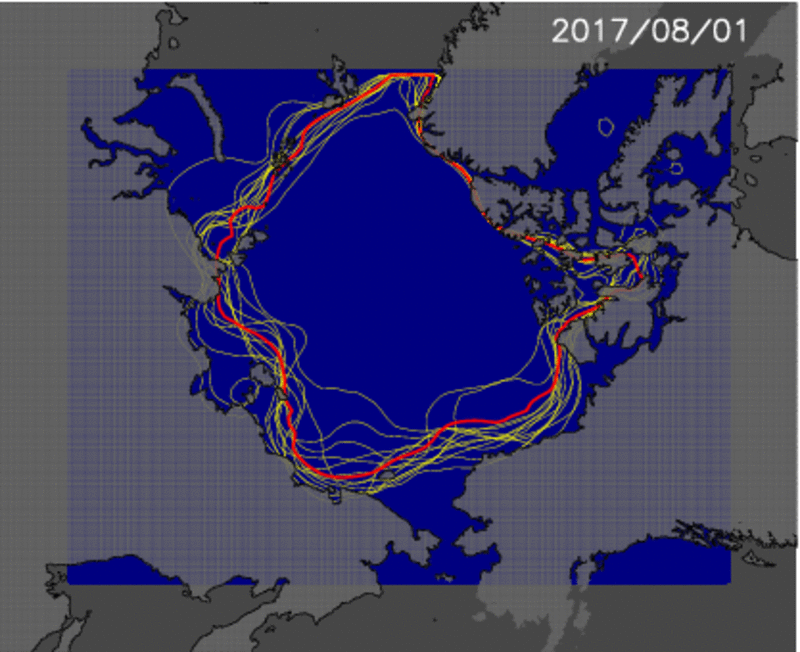
Method of Prediction:Tracking of sea ice from winter to spring
The way of this prediction is basically same as the first and second reports.
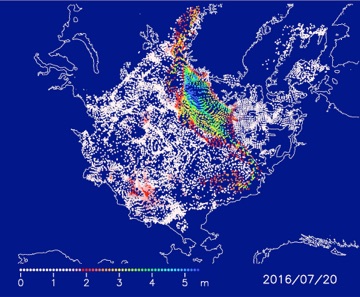
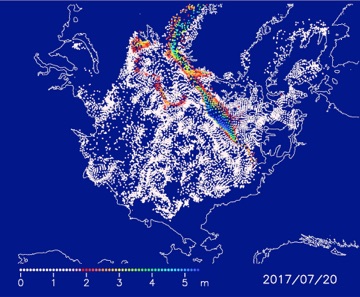
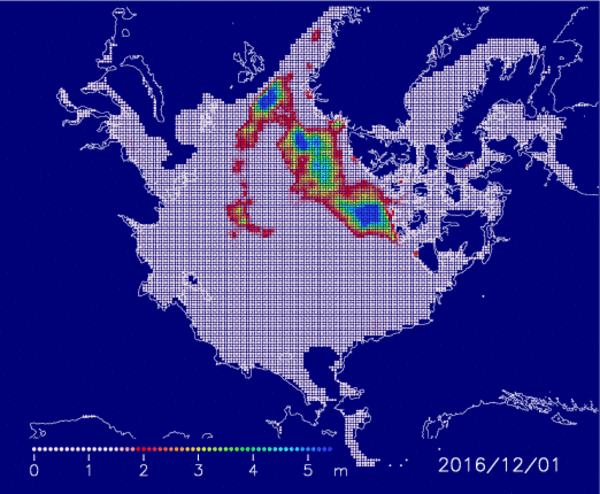
We distributed particles homogeneously over the Arctic sea ice on December 1, and traced the trajectories of the particles to July 20. Based on the relationship (linear regression line) between yearly particle concentration on July 20 and ice concentration on a specific day in summer, we predicted the ice area on the day.

If you have any questions about satellite monitoring of the Arctic Ocean, sea ice forecasting, or the forecasting methods used here, please contact the Sea Ice Information Center(sea_ice@nipr.ac.jp)
The research for this forecast method was started in GRENE Project. The sea ice forecast was conducted in ArCS Project (FY2015-2019).