A Changing Cryosphere in a Rapidly Warming Arctic: Properties and Processes
Principal Investigator:Teruo Aoki (NIPR)
Overview
Air temperature in the Arctic is rapidly increasing at twice the global mean due to Arctic Amplification. This would accelerate the surface melting of glaciers and ice sheet and shorten the snow cover duration, by which the ice-albedo feedback is enhanced.
As a result, it is expected to cause a further sea level rise and changes in the surrounding environments and climate conditions in the Arctic. We implement the following three sub-programs to clarify these mechanisms and their impacts.
In sub-program 1, we will quantify the changes in ice sheet mass balance and cryospheric environment in the Arctic and elucidate their mechanisms, by means of in-situ measurements, satellite remote sensing, and numerical modelling. We focus on the near-surface physical and chemical processes such as glacial microbes, light-absorbing aerosols, and snow grain growth, which affect the snow and ice albedos.
Under sub-program 2, we will study the past warming trends and environmental change in Greenland since the Industrial Revolution. We will also investigate abrupt climate changes during the last glacial period and their links to the climate and environment in mid-low-latitudes. Our study will provide us with essential information for understanding of mechanisms and impacts of abrupt climate changes, which is prerequisite to prepare for future global warming and its socio-economic impacts.
In sub-program 3, we will clarify processes of chemical reactions and cloud formation caused by local water circulation in seasonal sea ice areas and releases of aerosols and water vapor from sea ice areas through conducting meteorological monitoring and ice core analyses in the northwestern Greenland. Also, we aim to provide a quantitative database of the relevant processes to atmospheric models.
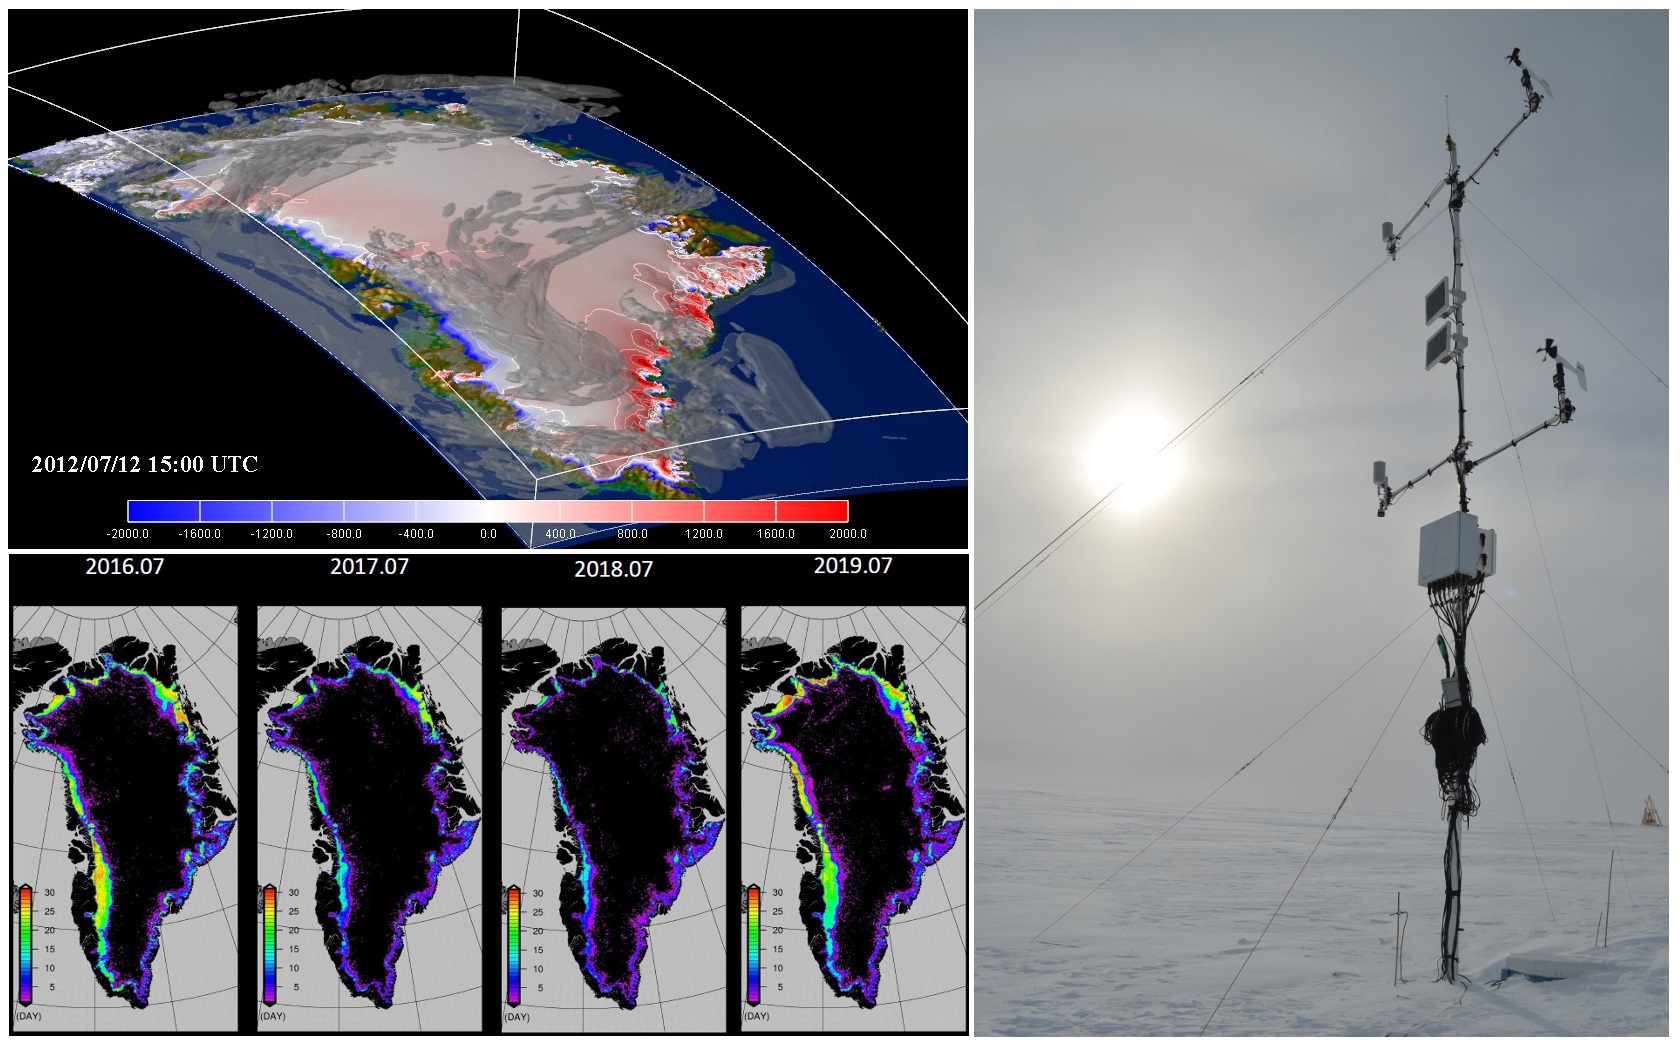
Figure 1: (Top left) Three-dimensional distribution of cloud cover over the Greenland Ice Sheet on July 12, 2012 simulated using the reginal climate model NHM–SMAP. The colored shaded area on the ice sheet surface indicates surface mass balance (mm/day). (Bottom left) Regional distribution of bare ice area on the ice sheet in July retrieved from satellite data (Terra/MODIS). (Right) Automatic weather station at the SIGMA-A site on the northwest Greenland Ice Sheet.
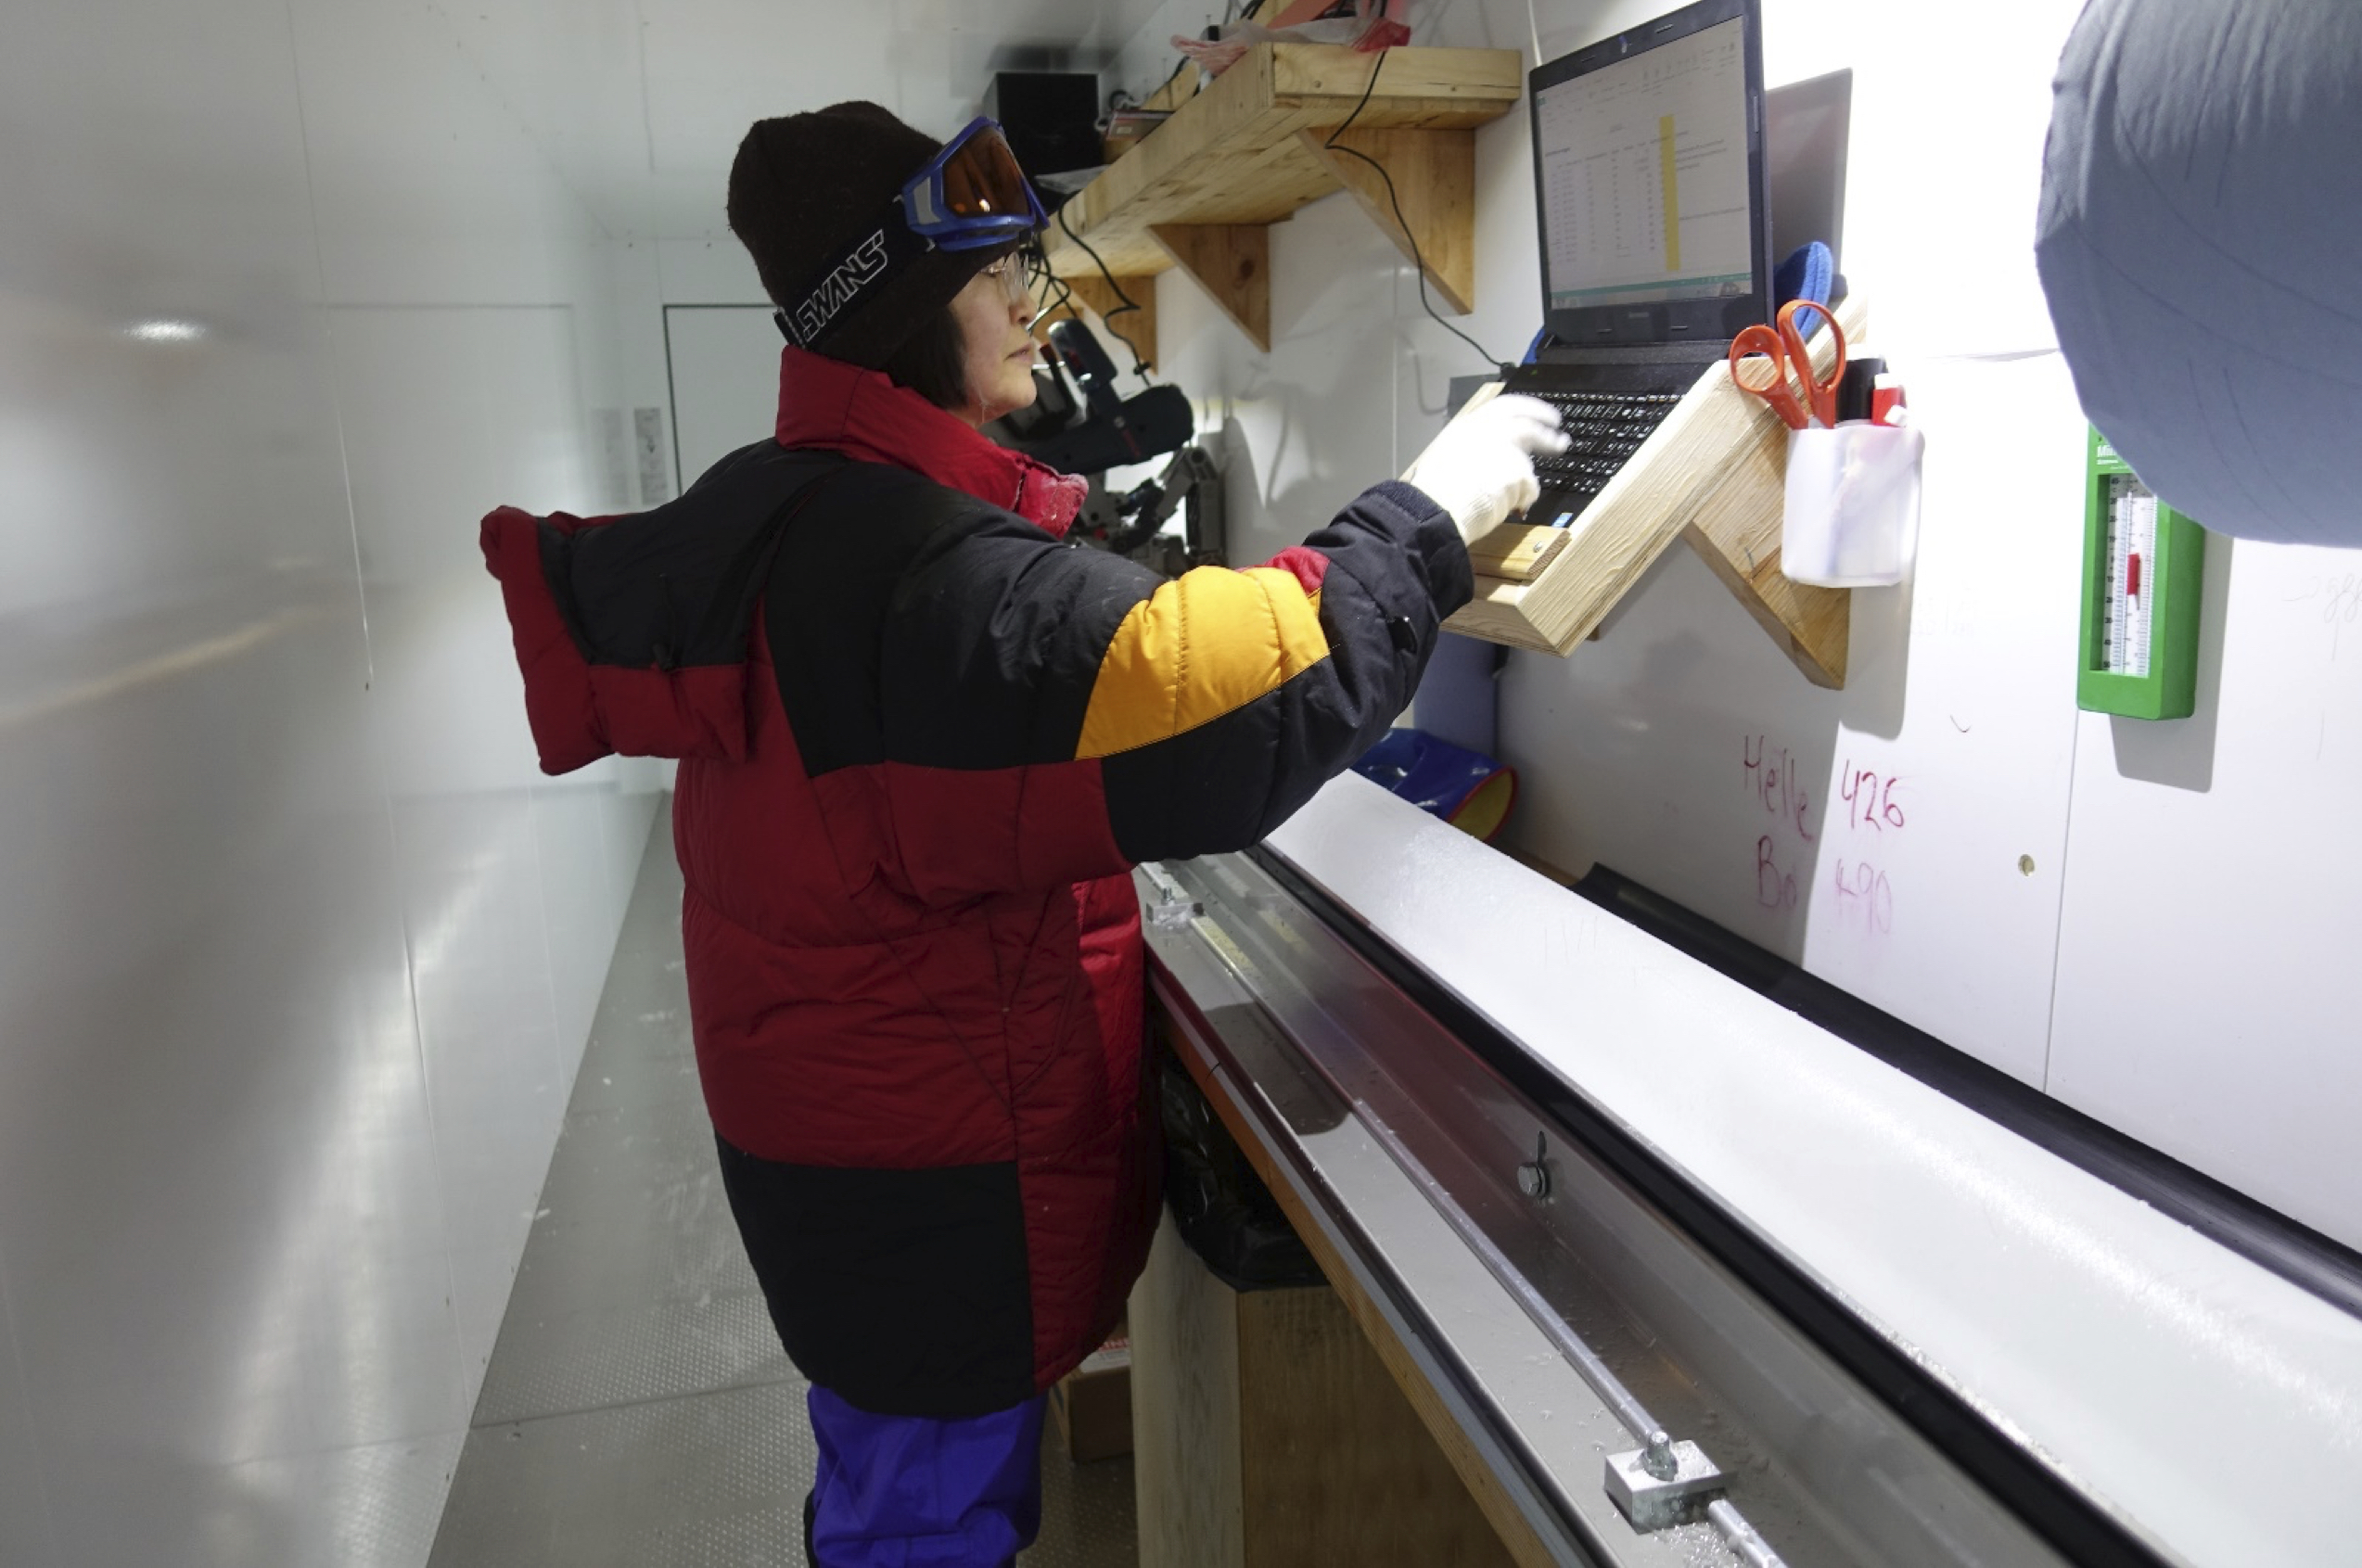
Figure 2: On site analysis of the ice core drilled at the East Greenland Ice drilling Project (EGRIP) field station on the Greenland Ice Sheet